Author and unit
QiankunZhangaJin WookHwangaJoung-HwanOhaChan HoParkaShin HyeChungbYun-SilLeeacJeong-HwaBaekacHyun-MoRyooacKyung MiWooac
a
Department of Molecular Genetics, Dental Research Institute and BK21 Program, School of Dentistry, Seoul National University, Republic of Korea
b
Department of Dental Biomaterials Science, School of Dentistry, Seoul National University, Republic of Korea
c
Department of Pharmacology & Dental Therapeutics, School of Dentistry, Seoul National University, Republic of Korea
Biomaterials
◪ Joumal Impact Factor:8.402
◪ Year:2017.10
◪ Received 28 September 2017, Accepted 2 October 2017, Available online 4 October 2017.
Abstract
Host responses to a biomaterial critically influence its in vivo performance. Biomaterial architectures that can recruit endogenous host stem cells could be beneficial in tissue regeneration or integration. Here, we report that the fibrous topography of biomaterials promotes the recruitment of host mesenchymal stem cells (MSCs) by facilitating the macrophage phenotype transition from M1-to-M2. Electrospun poly (ε-caprolactone) fiber (PCL-fiber) films were implanted into the subcutaneous tissues of rats, and the response of host cells to the PCL-fiber was evaluated and compared with those of solid ones (PCL-solid). During the initial post-implantation period, greater numbers of cells were recruited and adhered to the PCL-fiber compared to the PCL-solid, and the cells exhibited the M1 phenotype, which was supported by the enhanced adsorption of complement C3a to the implanted PCL-fiber. Subsequently, the PCL-fiber supported the macrophage phenotype transition from M1-to-M2, which was confirmed by the ratio of M2/M1 marker (CD163/CCR7)-positive cells and by the expression of M2/M1 markers (arginase-1/iNOS). The PCL-fiber also reduced the formation of foreign body giant cells. MSC marker (CD29, CD44, and CD90)-positive cells began to appear as early as day 4 on the PCL-fiber, while few MSCs were observed on the PCL-solid. The MSCs migration ex vivo assay showed that MSCs substantially migrated across the trans-wells toward the implanted PCL-fiber. The cells on the implanted PCL-fiber expressed and secreted substantial levels of SDF-1 (CXCL-12), while anti-SDF-1 neutralizing antibody abrogated the MSCs migration. Taken together, these results provide evidence that the fibrous topography of biomaterials enhances the recruitment of MSCs by promoting macrophage recruitment, facilitating M1-to-M2 transition, and enhancing SDF-1 secretion.
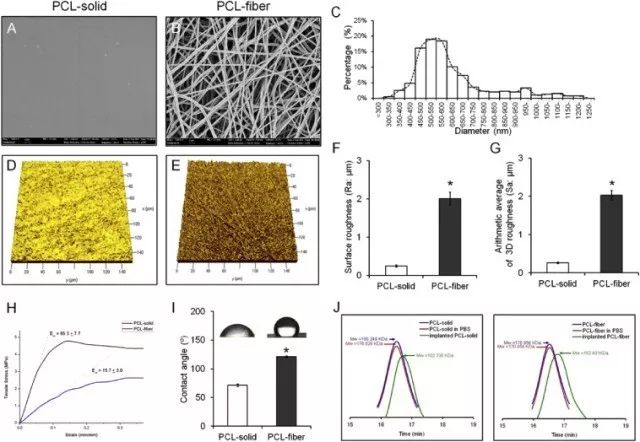
Fig. 1. Characteristics of the PCL-solid and PCL-fiber. The SEM images of PCL-solid (A) and PCL-fiber (B) were observed. Scale bars represent 2 μm. The fiber diameters of PCL-fiber were measured from SEM images and the distribution is presented (C). The 2D and 3D roughness of the PCL-solid and PCL-fiber (D, E, F, and G) were measured, respectively. Tensile strength and elastic modulus (H), water contact angle (I), and biodegradation (J) were also detected. Data are shown as the mean ± SD (n = 10).* Significant differences between PCL-solid and PCL-fiber (p < 0.05).
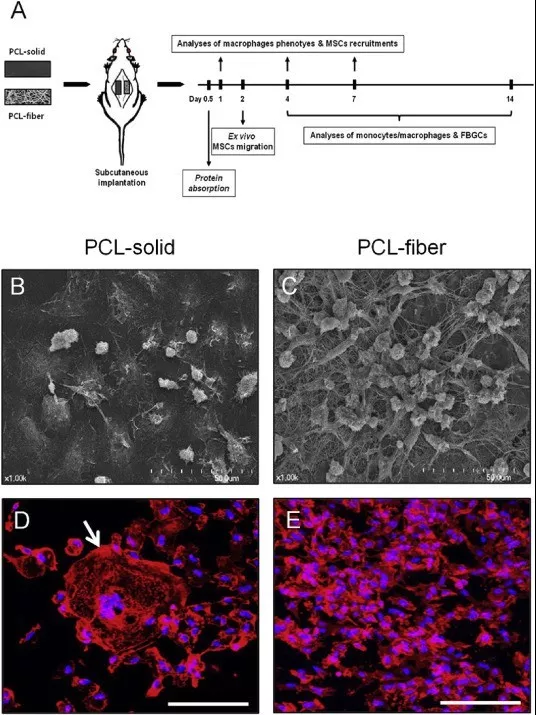
Fig. 2. A flow diagram of the experiments conducted (A). The SEM images of the cells adhered onto the PCL-solid (B) and PCL-fiber (C) post-implantation. Scale bars represent 50 μm. Stainings for nuclei with DAPI (blue) and for cytoskeletal actin with Rhodamine-Phalloidin (red) were performed on the PCL-solid (D) and PCL-fiber (E). The arrow presents multi-nuclear foreign body giant cells. Scale bars represent 100 μm. (For interpretation of the references to colour in this figure legend, the reader is referred to the web version of this article.)
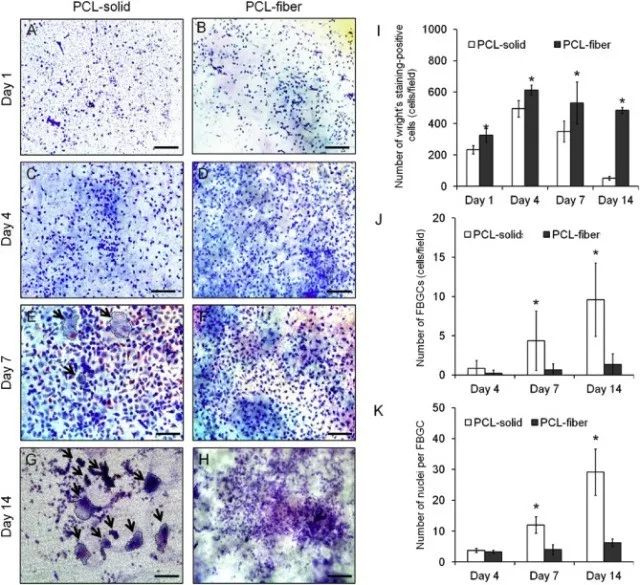
Fig. 3. Wright's staining images of the cells adhered onto the PCL-solid (A, C, E, and G) and PCL-fiber (B, D, F, and H). The arrow presents FBGCs (number of nuclei ≥ 3). Scale bars represent 100 μm. The numbers of the mono-nucleated monocyte/macrophages (I), FBGCs (J), and nuclei per FBGC (K) were counted. Data are shown as the mean ± SD (n specimen = 4, 12 random areas per specimen). * Significant differences between PCL-solid and PCL-fiber (p < 0.05).
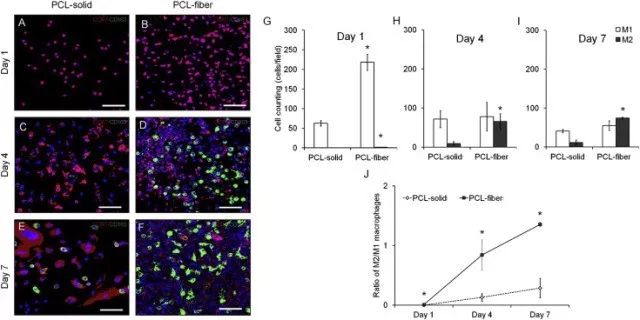
Fig. 4. Immunofluorescence analyses on the macrophage polarization-related markers in the cells adhered onto the PCL-solid and PCL-fiber at days 1, 4, and 7 post-implantation. Fluorescence images of adhered cells, which were immunostained for CCR7 (red, M1 phenotype marker) or CD163 (green, M2 phenotype marker), were observed on PCL-solid (A, C, and E) and PCL-fiber (B, D, and F). The number of CCR7-or CD163-positive cells (M1 or M2) (G-I) and the ratio of CD163/CCR7-positive cells (M2/M1) (J) were counted. Data are shown as the mean ± SD (n specimen = 4, 6 random areas per specimen). * Significant differences between PCL-solid and PCL-fiber (p < 0.05). (For interpretation of the references to colour in this figure legend, the reader is referred to the web version of this article.)

Fig. 5. qPCR analyses on the expression of macrophage polarization-related genes on PCL-solid and PCL-fiber at days 1, 4, and 7 post-implantation. Expression of M1 phenotype marker (iNOS) and M2 phenotype marker (arginase-1) were detected (A-C). Expression ratio of arginase-1/iNOS-positive (M2/M1) was calculated (D). Data are shown as the mean ± SD (n specimen = 4). * Significant differences between PCL-solid and PCL-fiber (p < 0.05).
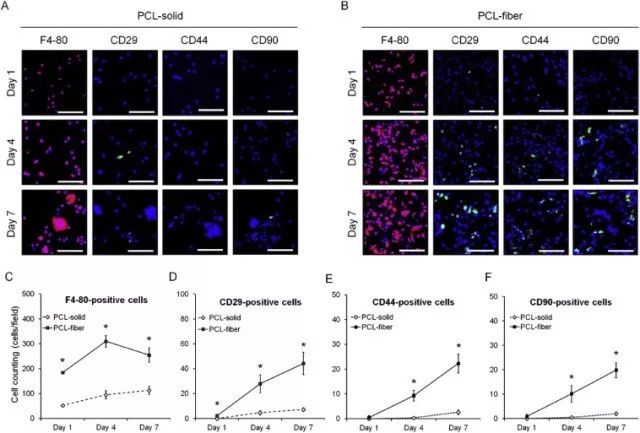
Fig. 6. Immunofluorescence analyses on the MSCs-related markers in the cells adhered onto the PCL-solid and PCL-fiber at days 1, 4, and 7 post-implantation. Fluorescence images of adhered cells, which were immunostained for F4-80 (red, macrophage marker), CD29, CD44, and CD90 (green, MSCs markers), were observed on PCL-solid (A) and PCL-fiber (B). Scale bars represent 100 μm. The numbers of F4-80-cells, CD29, CD44, and CD90-positive-cells were counted, respectively (C, D, E, and F). Data are shown as the mean ± SD (n specimen = 4, 6 random areas per specimen). * Significant differences between PCL-solid and PCL-fiber (p < 0.05). (For interpretation of the references to colour in this figure legend, the reader is referred to the web version of this article.)
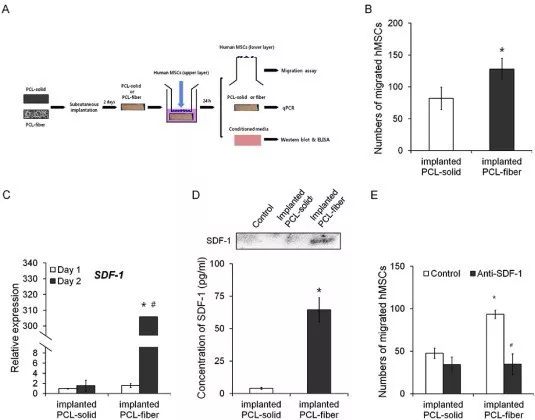
Fig. 7. Effects of the implanted PCL-fiber and PCL-solid on the human MSCs migration ex vivo. A schematic diagram of ex vivo experiments is present (A). The number of migrated hMSCs was counted in a trans-well culture (B). The expression of SDF-1 transcript was examined at days 1 and 2 post-implantation (C). To analyze the secretion of SDF-1 protein from the cells onto the PCL-fiber to the medium, Western blot and ELISA assays were performed (D). With or without neutralization of SDF-1, the numbers of migrated human MSCs were counted (E). * Significant differences between PCL-solid and PCL-fiber (p < 0.05). # Significant differences between day 1 and day 2 after implantation (p < 0.05).
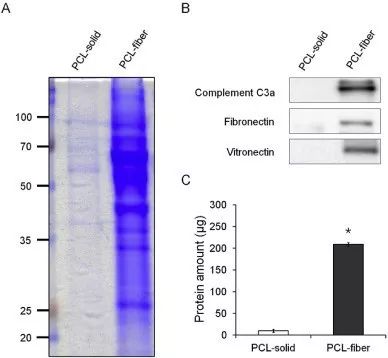
Fig. 8. Protein adsorption onto the PCL-solid and PCL-fiber implanted into the subcutaneous tissues for 12 h. A same portion of the adsorbed proteins onto the PCL-solid and PCL-fiber was analyzed by SDS-PAGE and stained with Coomassie blue (A). Western blot analyses on the complement C3a, fibronectin, and vitronectin adsorbed onto the PCL-solid and PCL-fiber were performed (B), and total amounts of the adsorbed proteins were determined (C). * Significant differences between PCL-solid and PCL-fiber (p < 0.05). (For interpretation of the references to colour in this figure legend, the reader is referred to the web version of this article.)
Conclusion
In this study, we investigated the effects of the fibrous topography of biomaterials on MSC recruitment and its underlying molecular and cellular events. Electrospun PCL-fiber was implanted into the subcutaneous tissues of rats, and the responses to the PCL-fiber were evaluated and compared with those of the PCL-solid. During the initial post-implantation periods, greater numbers of cells were recruited and adhered to the PCL-fiber compared to the PCL-solid, and the cells exhibited the M1 phenotype. Later, the PCL-fiber increased the ratios of M2/M1 marker (CD163/CCR7)-positive cells and the M2/M1 marker (arginase-1/iNOS) expression at greater levels than the PCL-solid, and reduced the formation of FBGCs. MSCs marker (CD29, CD44, and CD90)-positive cells began to appear as early as day 4 on the PCL-fiber, while few MSCs were observed on the PCL-solid. The MSC migration ex vivo assay showed that the MSCs substantially migrated across the trans-wells toward the implanted PCL-fiber. The cells on the implanted PCL-fiber expressed and secreted substantial levels of SDF-1 (CXCL-12), and anti-SDF-1 neutralizing antibody abrogated the MSC migration. Taken together, we conclude that the fibrous topography of biomaterials enhances MSC recruitment by promoting macrophage recruitment, facilitating M2 polarization, and enhancing SDF-1 secretion.

